Notes on Expected Returns by Antti Ilmanen
Expected Returns: An Investor’s Guide to Harvesting Market Rewards
This is not a traditional book review, but rather a summary. I’ve chosen this approach as I don’t have the deep expertise in the book’s main subject - the analysis of financial asset returns - to provide a critical analysis of its contents. While my graduate studies in quantitative finance provided me with a solid background to understand the book, my engagement with the subject since then has been limited to general reading. I decided to write this summary to help myself understand and remember key points from the book.
It’s important to note that the book was published in 2011, so much of the research and knowledge in this field has evolved since then. I encourage readers to approach both the book and this summary with a critical mindset.
Introduction
To say that Expected Returns feels like a tour de force is an understatement. The book provides a comprehensive overview and analysis of individual asset classes, trading strategies, and the underlying economic fundamental factors that interconnect to generate asset returns. The core messages of the book are pragmatic and offer sobering conclusions:
- There is a crucial distinction between an asset’s ex-ante risk premium and its ex-post realized returns. The former represents the minimum perceived reward required for holding an asset compared to a risk-free investment. The latter represents the actual realized returns of an asset, which can be lower or higher than the ex-ante risk premium.
- Ex-ante premiums can typically be explained by the sum of an asset’s sensitivities (known as betas) to different risks, whether they be business cycle risk, inflation risk, illiquidity risk, or others. Investors demand higher rewards for greater risk, seeking compensation for assets that perform particularly poorly during challenging market conditions. What often appears as above-average asset returns is actually greater exposure to certain risks.
- Beyond rational risk-based premiums, markets can be subject to investor irrationality when pricing assets. Examples include the consistent overpricing of attractive growth equities (due to extrapolative expectations) and underpricing of value equities. However, it is often difficult to determine whether returns are driven by risk premiums or market irrationality.
- Predicting asset returns is a complex task, and people frequently mistake past returns as indicators of future performance. Our understanding of past performance is further distorted by various biases, including survivorship bias, time-period bias, fat-tails bias (the “peso problem”), and data mining bias. Forward-looking indicators typically provide better estimates of future returns.
Sources of returns
Firstly, we need to understand how assets are priced. The classical formula taught in undergraduate economics and finance classes states that the price is equal to the expected value of discounted future cash flows:
$$ E[\text{Asset Value}] = E \left[ \sum_{t=1}^{\inf} \frac{CF_t}{(1+r)^t} \right] $$
where r is the discount rate. The discount rate can be thought of as the return that the asset is expected to provide to investors to compensate them for holding that asset. It contains compensation for different risks associated with the asset. The return on the riskless asset (such as a Bank of England deposit or U.S. Treasury bill) is used to measure the riskless rate of return. Any other assets can be viewed as containing certain risks that need to be priced into the required return:
$$ E[\text{Asset Return}] = risk-free\ rate + \sum_{f}^{Factors} Asset Beta_{f} * Risk Factor Premium_{f} $$
where asset beta represents the asset’s covariation with a particular risk factor, and risk factor premium indicates how much additional return investors require for accepting a particular systematic risk. Risk factors are asset-dependent, but common ones include liquidity risk, market risk, inflation risk, and interest rate risk.
It’s important to note that these premiums are not static and can change over time (known as time-varying risk premiums).
Setting aside the challenges of estimating different components of the above equation, this approach to asset pricing is based on assumptions of rational investors and frictionless markets - markets where any risk-free profit opportunity (arbitrage) is immediately exploited by sophisticated market participants. However, markets often exhibit patterns that don’t follow these assumptions, which is where behavioral finance insights become relevant.
There are multiple cases where market behavior is difficult to reconcile with the rational investor hypothesis. Speculative bubbles and certain trading strategies (such as value and momentum, which will be explained later) are prime examples. Ilmanen points out that while behavioral psychology offers explanations for these phenomena (herding, extrapolative expectations, etc.), alternative explanations through specific risk premiums are also possible. This applies not only to market imperfections themselves but also to claims of extraordinary returns by various actors within the financial industry. Financial firms (e.g., hedge funds) that market their above-average market returns as results of clever trading might actually be demonstrating over-exposure to certain systematic risks. Empirically separating returns from idiosyncratic bets versus returns from higher sensitivity to systematic factors can be extremely challenging. Furthermore, even when market imperfections exist, they may not necessarily be corrected. This persistence can occur for several reasons: correcting mispricing might take too long (requiring positions to be held for extended periods), market frictions may exist (such as trading costs and margin requirements), or the uncertainty surrounding probabilities of different future outcomes might be too high.
In the subsequent chapters, Ilmanen examines individual return sources and associated risk premiums from three perspectives: the risk premiums of assets themselves, the risk premiums of different trading strategies, and a selection of risk factors that require risk premiums.
Assets
Equities are generally considered one of the most consistently performing asset classes. The historical annual excess returns of U.S. stocks over government bonds (the equity-bond risk premium) averaged 4% during 1900-2009. Global returns are lower but remain positive overall. However, these numbers varied significantly between decades, and there were extended periods where stocks underperformed bonds. Multiple explanations exist for why equities might require/have required higher risk premiums overall. Some authors point to investors’ overweighting of high-risk events in the past (such as the Great Depression) or structural uncertainties affecting the economy (such as policy impacts) and its future growth prospects.
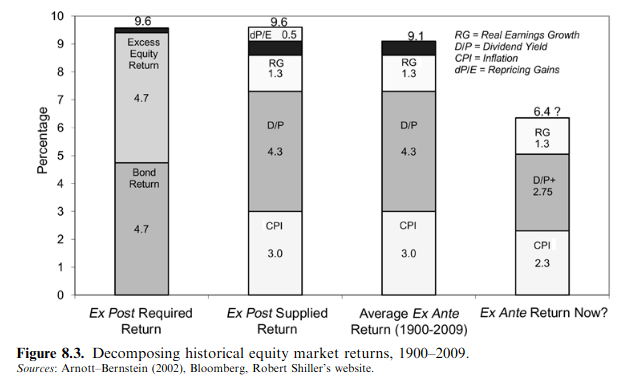
One way to understand the sources of returns is to decompose equity returns into individual components: inflation rate, dividend yield, real earnings growth, and multiple expansion. The inflation rate affects prices directly through increases in nominal earnings. Dividends and real earnings growth have been shown to track GDP growth, though only when including net new share issuance. The final element, multiple expansion, is highly procyclical and has been shown to expand during periods of mild inflation and low macroeconomic volatility. Considering these individual components, Ilmanen expects 6.4% nominal returns in the future (assuming no multiple expansion).
A similar decomposition of expected returns can be done for government bonds. The return of a bond (with maturity longer than a base, risk-free maturity) can be viewed as the sum of an inflation component, average base rates over the maturity period (essentially replicating the longer maturity bond by rolling the nominal amount every base period), and a specific risk premium (known as the bond risk premium, BRP).
The nominal yield of a bond contains all these components together, while the spread between the longer and base maturity bonds exclusively contains the interest rate expectation and the BRP. The average base rate can be calculated using interest rate futures. The most complex component is the bond risk premium. The predominant explanations for this term include level-dependent inflation uncertainty (higher inflation levels are associated with greater uncertainty and therefore require larger compensation), equity market and/or recession hedging ability (bonds being known safe-haven assets), supply-demand factors, and other cyclical effects.
Over long periods (1952-2009), the average government bond return has been approximately 1% in excess of short-term rates.
For corporate bonds, the premiums over government bonds encompass risk premiums for default and downgrade losses, embedded options present in some bonds (such as call options to repay the bond at par before maturity), higher liquidity premium, procyclical nature, and higher equity sensitivity (the latter three compared to Treasuries).
Most corporate bond indices have outperformed Treasuries by only a small margin of 0.3% (during 1973-2009). The difference between ex-ante yield and ex-post returns is quite dramatic for corporate bonds. Ilmanen estimates that the Barclays Investment Grade Corporates Index had an ex-ante yield of 120 basis points, while it actually delivered only approximately 30 basis points between 1973-2009. According to Ilmanen, the reason for such low actual ex-post returns might be that investors constrained by rating requirements often need to sell corporate bonds when they are downgraded. Supporting this thesis is the fact that downgraded corporate bonds (known as “fallen angels”) deliver much better ex-post returns. Ilmanen concludes the chapter with a warning about corporate bonds, citing David Swensen’s view that non-government bonds may not deserve a strategic allocation in institutional portfolios.
The final chapter analyzing returns from the asset class perspective examines alternative assets, including real estate, hedge funds, and private equity funds. Ilmanen maintains skepticism about extraordinary returns from these asset classes. For real estate, the historical rates of return (1978-2008) were approximately 10% for commercial, 5.7% for residential, and 8.8% for farmland. Listed real estate indices showed returns around 11.9%. However, many of these returns do not account for additional costs, fees, and taxes, suggesting actual returns were likely lower.
Estimating hedge fund returns is more challenging due to survivorship and reporting biases. Historical time series exclude failed hedge funds, and funds may have some discretion in reporting their performance. Nevertheless, after accounting for these biases, hedge fund returns appear to remain positive - from 1995-2009, they delivered average returns of around 11.4%, which after fees consists of a 4.6% risk-factors component and a 3% alpha component (pure hedge fund manager skill).
Private equity and venture capital funds appear to perform somewhat worse. Several studies found that private equity investing yielded returns roughly equivalent to the S&P 500 index. After adjusting for lower liquidity risk and various specific risk factors, the overall performance is significantly lower than the index. However, this applies to the average PE fund. Top-quartile PE funds tend to consistently outperform the index, and being such a fund correlates with higher future returns. This might result from network effects, as more prominent PE and VC funds have established networks that enable earlier access to certain deals. Ilmanen concludes that “the only way to justify active PE/VC investing, given risks and costs, is by an ability to invest in top-quartile funds. Identifying them in advance is not easy but perhaps not as difficult as in liquid markets” (p. 245).
Trading Strategies
In the next section of the book, the author shifts perspective from individual asset classes to specific trading strategies, examining their returns and risks.
He begins with value-oriented equity selection, broadly described as selecting value stocks over growth stocks. Several variations of this strategy exist. In a classic example, Fama and French create a portfolio that is long value and short growth stocks (called VMG, value-minus-growth). Annually, they rank stocks based on their book-to-price ratio, buying the cheapest 30% and shorting the most expensive 30%. The VMG return is the difference between the long and short portfolio returns. For U.S. equities, this strategy has been consistently profitable, with average annual returns of 4.1%. Similar results are observed across other countries and asset classes. Ilmanen argues that this market opportunity has persisted due to analysts’ extrapolative expectations. Their assumed earnings growth rates are too optimistic, making growth stocks overvalued. While rational explanations based on risk premiums exist, they are harder to justify given the similar risk profiles of value and growth stocks.
The second strategy is carry trading, most commonly implemented in currency markets. Buying high-yielding currencies while shorting low-yielding ones has proven profitable for 50 years. Market efficiency hypothesis would suggest such advantages should disappear as arbitrageurs force high-yield currencies to appreciate relative to others, offsetting yield gains. However, this hasn’t occurred. Ilmanen suggests this discrepancy might reflect an previously unrecognized risk premium associated with carry trades. These trades are often overcrowded and populated by highly leveraged traders, making them vulnerable to economic changes. Thus, the reward may actually be a risk premium for infrequent but substantial losses (negative skewness with high kurtosis). This was demonstrated in the recent destabilizing carry trade unwinding when the Japanese central bank raised deposit interest rates (source). Carry trading essentially amounts to selling disaster insurance in disguise. This type of strategy, generally called volatility selling, includes carry trading and the insurance business itself.
The final strategy examined is momentum trading, which involves buying assets whose prices have risen and selling those that have fallen. Similar to the VMG portfolio, historical data shows such a strategy would be profitable across many asset classes. Statistically, this indicates that asset returns exhibit positive short-term autocorrelation (momentum bias) and negative long-term autocorrelation (mean-reversion). This strategy has performed well even during equity market declines and periods of rising volatility. Ilmanen attributes this phenomenon to irrational investor behavior, similar to that driving the value strategy. Many investors extrapolate past returns and overreact to popular stories (as illustrated by the recent DeepSeek AI model release).
Conclusion
Expected Returns was published during the aftermath of the Great Financial Crisis of the late 2000s. Some of the results and forecasts in the book have been proven wrong by subsequent economic developments and research. While some strategies mentioned in the book might be obsolete now (though anecdotal evidence suggests that carry, value, and momentum trading strategies still remain part of the investment toolkit), this is not surprising given the significant events of the past 15 years. We’ve witnessed the quantitative easing and bullish zero-interest rate environment of the 2010s, followed by supply shocks, inflation spikes, and high interest rates that are becoming a persistent feature of our current economic landscape.
However, even though we live in a very different world than that of the early 2010s, the core analysis of the book remains timeless: asset prices are fundamentally driven by the risks embedded within them, and asset returns are compensation for bearing those risks.